Performance Since First Publication on May 10, 2013
This page contains the verifiable performance of the Model from its first publication date (on this website) on May 10, 2013. Since any proof of performance prior to this date is objectively impossible, public scrutiny began as of that date.
Over the 11 years and a half years of publication, it is clear the Model’s performance is in line with (one of) its main objectives: to get a significant chunk of stock market gains during a bull period.
Remember that the primary goal of the Model is to reduce losses during bear periods. Also keep in mind that this is actually the only way the Model can beat the long term performance of the stock market. We have yet to experience a true bear market during this amazing period so keeping pace with this explosive market has been admittedly quite a challenge.
Here is a graph of Model’s performance from the date of first internet publication.
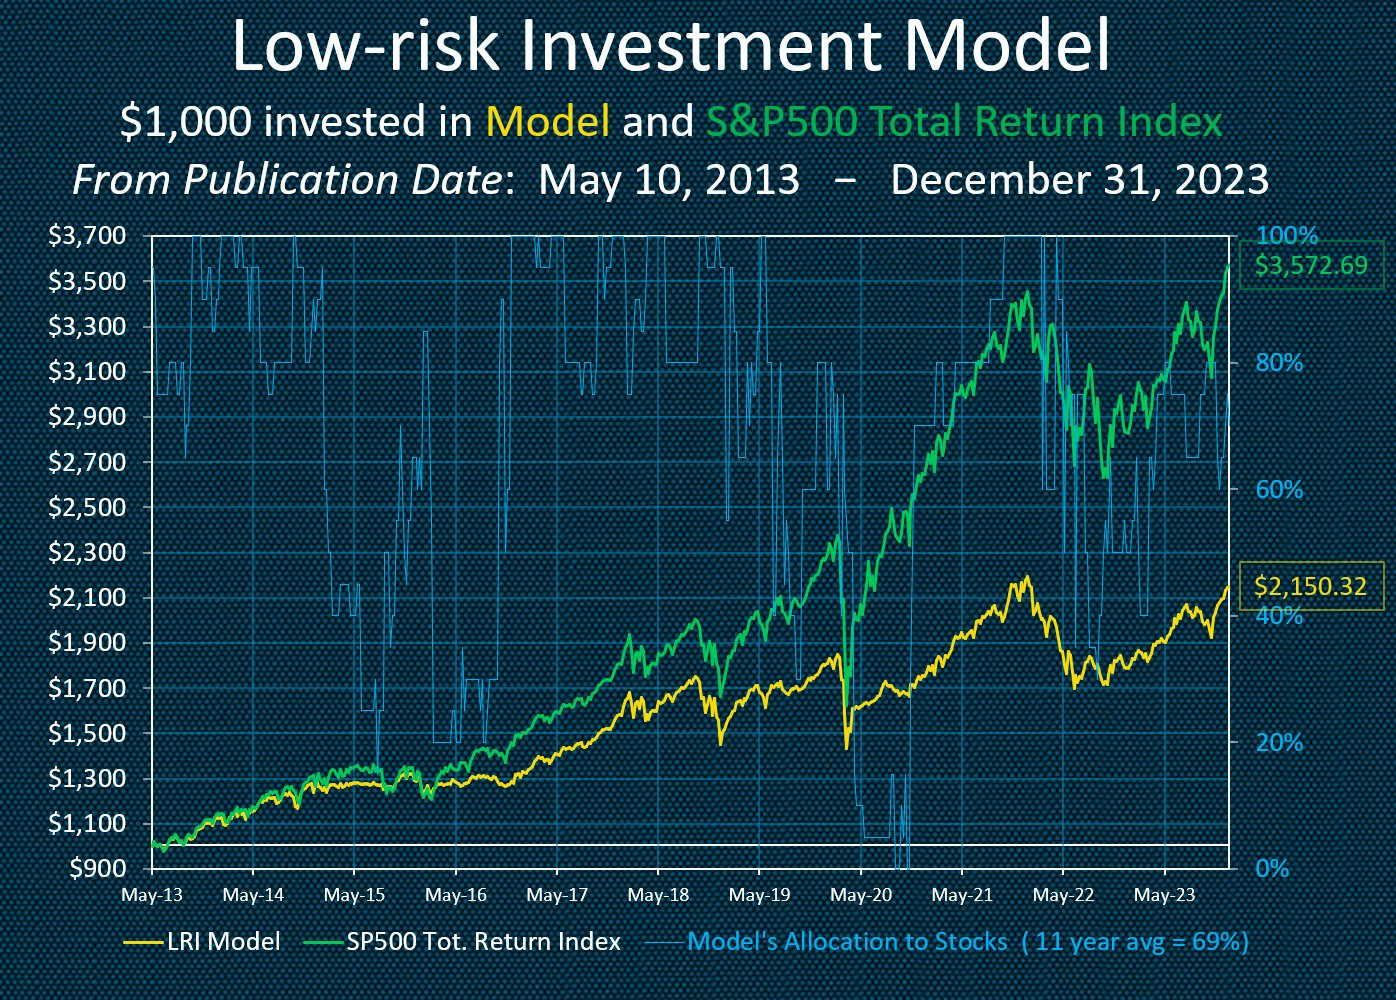
I changed the weekly updates back in 2014 to what I believe is a more accurate measure of actual performance. Instead of using just then regular S&P 500 Index, I now use the S&P 500 Total Return Index which includes all dividends. This is a better gauge of actual performance and allows anyone to compare his or her year-to-date portfolio results with the Model.
Remember that when the Model is say at 40% in stocks, the remaining 60% is not invested in fixed income (bonds) but in cash using current Treasury bill rates. It essentially means that the cash component is just sitting idle on the sidelines due to the interest rates being so low.
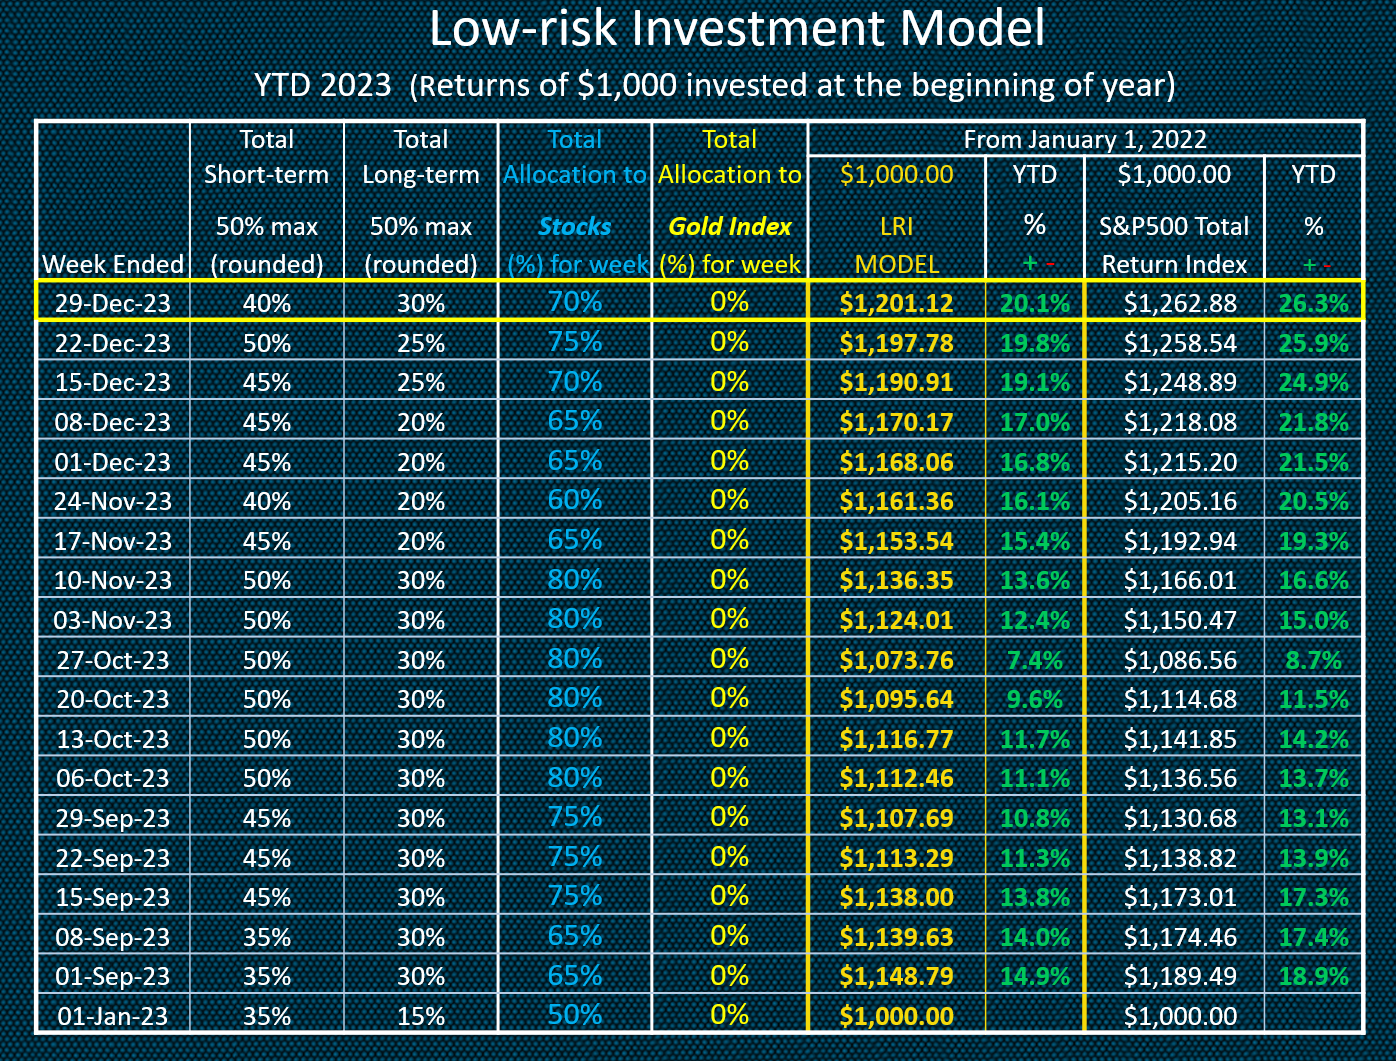
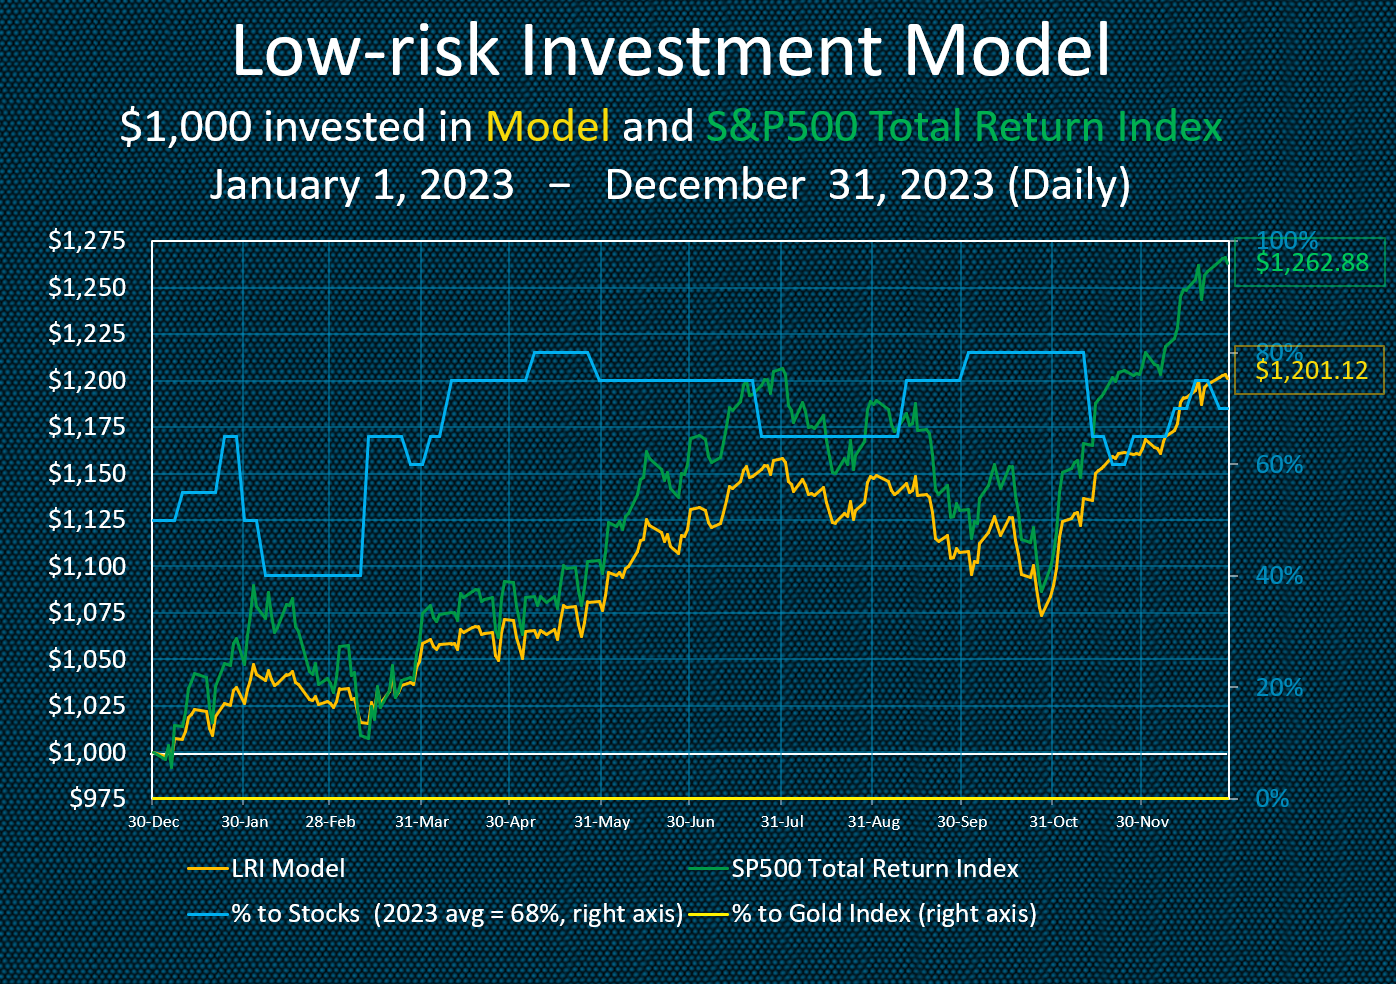
The chart below shows the results thus for 2023, a great rebound year from difficult 2022.
Long-term Performance
Initially the Model was comprised of four relatively simple components.
I began to score it in “real time” as a separate entity for possible future public exposure on January 1, 1985. The Model’s early success encouraged me to continue to use it as my primary investment tool.
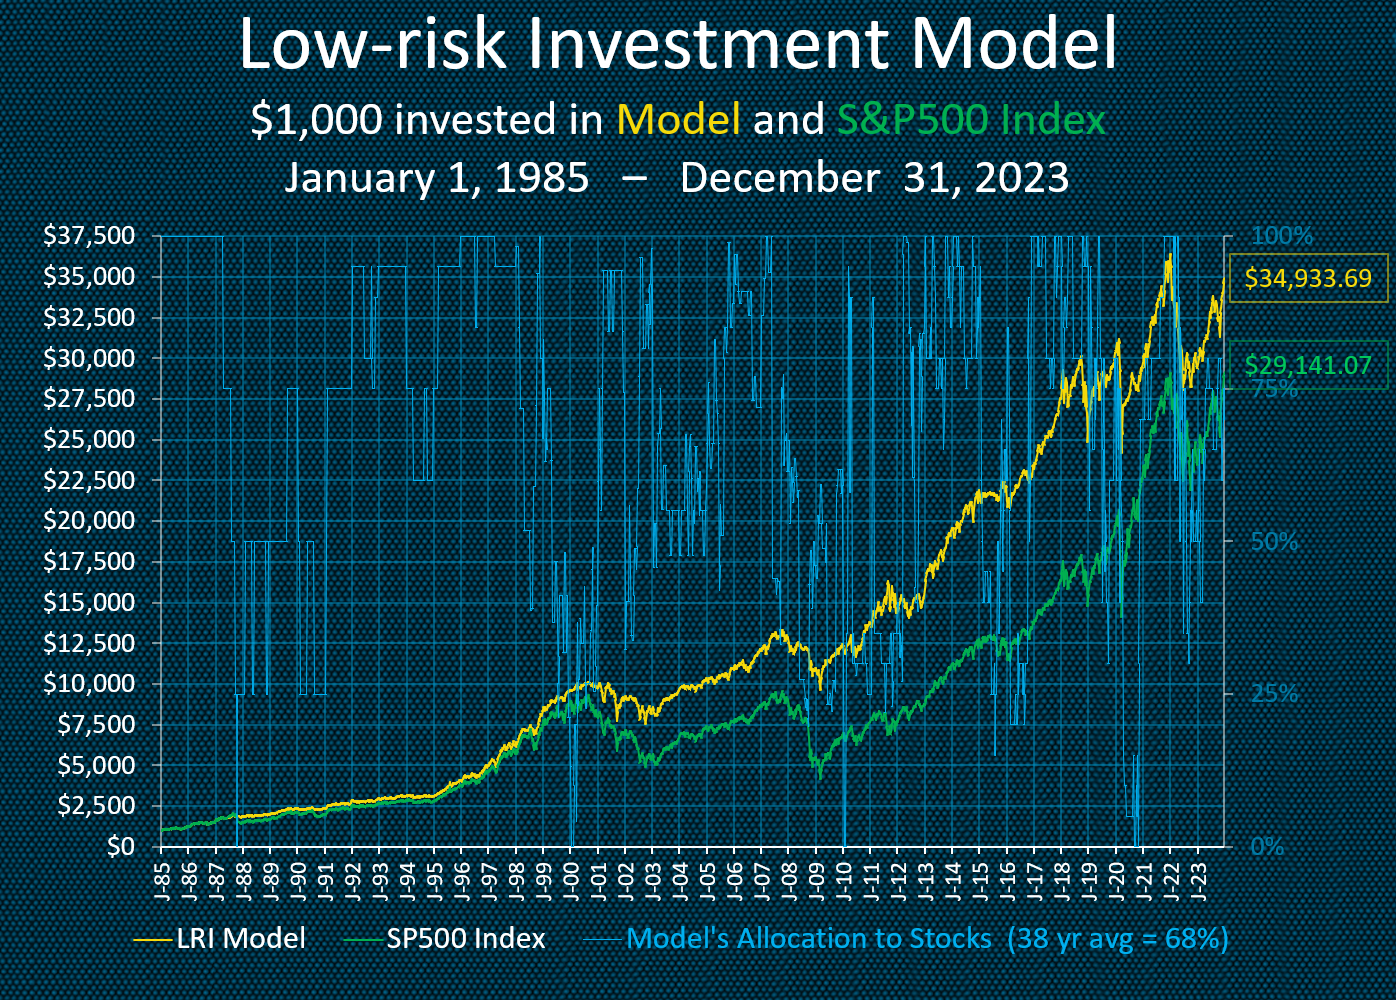
With changes to its components, over the past 39 years it has produced returns higher than a 100% stock market buy-and-hold strategy (S&P 500 Index only, not total return including dividends) with less than commensurate stock market risk.
Over these past three decades, the Model has averaged just 68% in stocks while producing average annual (compounded) returns of nearly 10.0%.
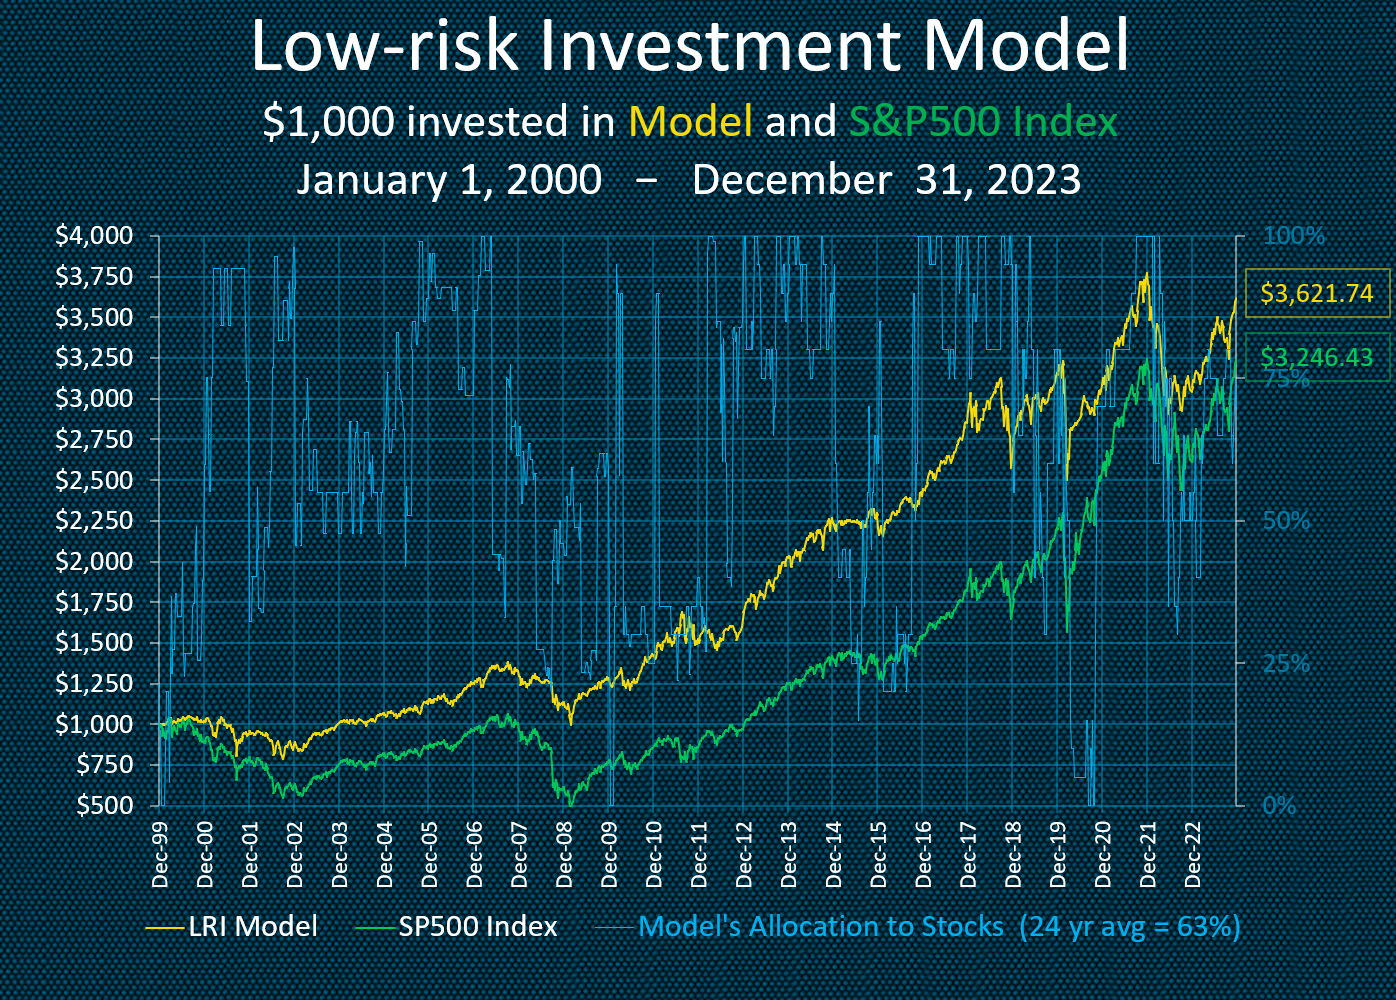
When viewing the graphs, the blue line uses the right-side Y axis. This is the percentage of the total model portfolio allocated to stocks (either large caps using the S&P500 index or small caps using the Russell 2000 index). The difference between 100% and the amount allocated to stocks is considered to be on the sidelines or in a money market fund. For purposes of calculating the Model’s returns, I use 90-day Treasury bill interest rates to approximate money market fund returns. I have never been a bond fan so no fixed income investment vehicles are used in the Model (even though I recognize they’ve done quite well for the last generation and belong in most portfolios).
The graph below reflects the results of the regular S&P500 index without dividends included.
This is a chart of each year’s individual (non-cumulative) results again using the regular S&P500 index without the inclusion of dividends through 2019.
Performance Since January 1, 2000